IEEE Transaction on Visualization and Computer Graphics (TVCG) -- InfoVis 2012

Interactive Level-of-Detail Rendering of Large Graphs

Michael Zinsmaier    Ulrik Brandes    Oliver Deussen    Hendrik Strobelt
University of Konstanz, Germany


Abstract

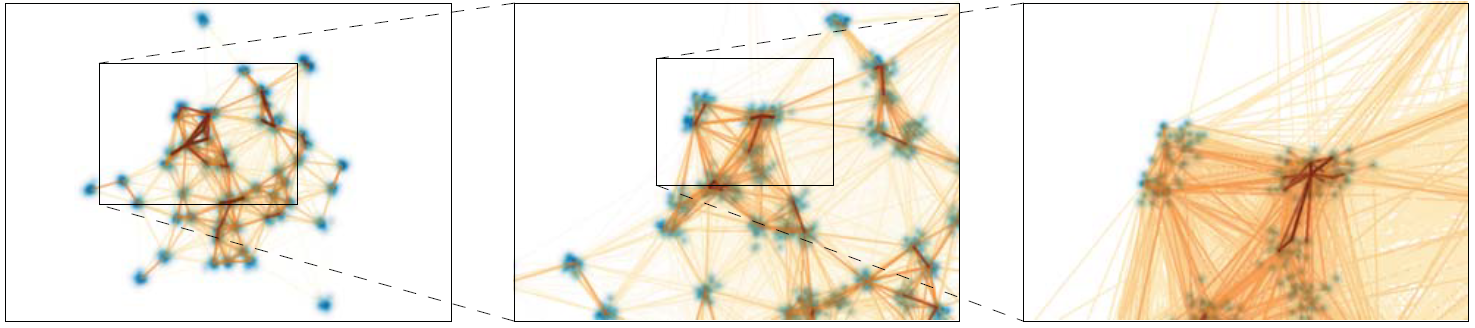
We propose a technique that allows straight-line graph drawings to be rendered interactively with adjustable level of detail. The approach consists of a novel combination of edge cumulation with density-based node aggregation and is designed to exploit common graphics hardware for speed. It operates directly on graph data and does not require precomputed hierarchies or meshes. As proof of concept, we present an implementation that scales to graphs with millions of nodes and edges, and discuss several example applications.


Video


See HD version on vimeo

Downloads

Paper
PDF (draft)
(11.2 MB)
 
Video
720p.mov (720p / H.264 / 37MB)
1080p.mov (720p / H.264 / 65MB)
 
LaGO Source Code and Excutable *
Require OpenGL3.3 capable graphics hardware and the Visual Studio 2010 Redistributable Package (32 bit, 64 bit)

provisional Windows 32 bit executable (.zip - 5 MB)
provisional Windows 64 bit executable (.zip - 5 MB)
Mac Version (QT based -- soon)
KNIME (see knime.org) Versions: 32 bit, 64 bit

 
* Disclaimer:

The original software uses several third party libraries under different open source licenses. This makes it a bit difficult to provide the code of our tool under one unifying license. Therefore we are currently porting the project to QT to reduce the amount of required libraries. So far we didn't have the time to build a convenient GUI and the labeling of nodes (former FreeType based) is not yet included. To close the gap between the unfinished QT version and our earlier tools there are Windows x86 & x64 binary builds available standalone and as visualization server for KNIME.

The following dataset is a derivative of the Germany file of the Open Street Map database (www.openstreetmap.org) and therefore available under the Open Database License. It consists of one data point for each building in Germany (building corners averaged): download here.


Further Reading

Technical details can be found in Michael Zinsmaier's master project -- see project page.

BibTex

@article{ZinsmaierBDS12,
  author    = {Michael Zinsmaier and
               Ulrik Brandes and
               Oliver Deussen and
               Hendrik Strobelt},
  title     = {Interactive Level-of-Detail Rendering of Large Graphs},
  journal   = {IEEE Transaction on Visualization and Computer Graphics},
  volume    = {18},
  number    = {12},
  year      = {2012},
  pages     = {2486-2495},
  ee        = {http://doi.ieeecomputersociety.org/10.1109/TVCG.2012.238}
}