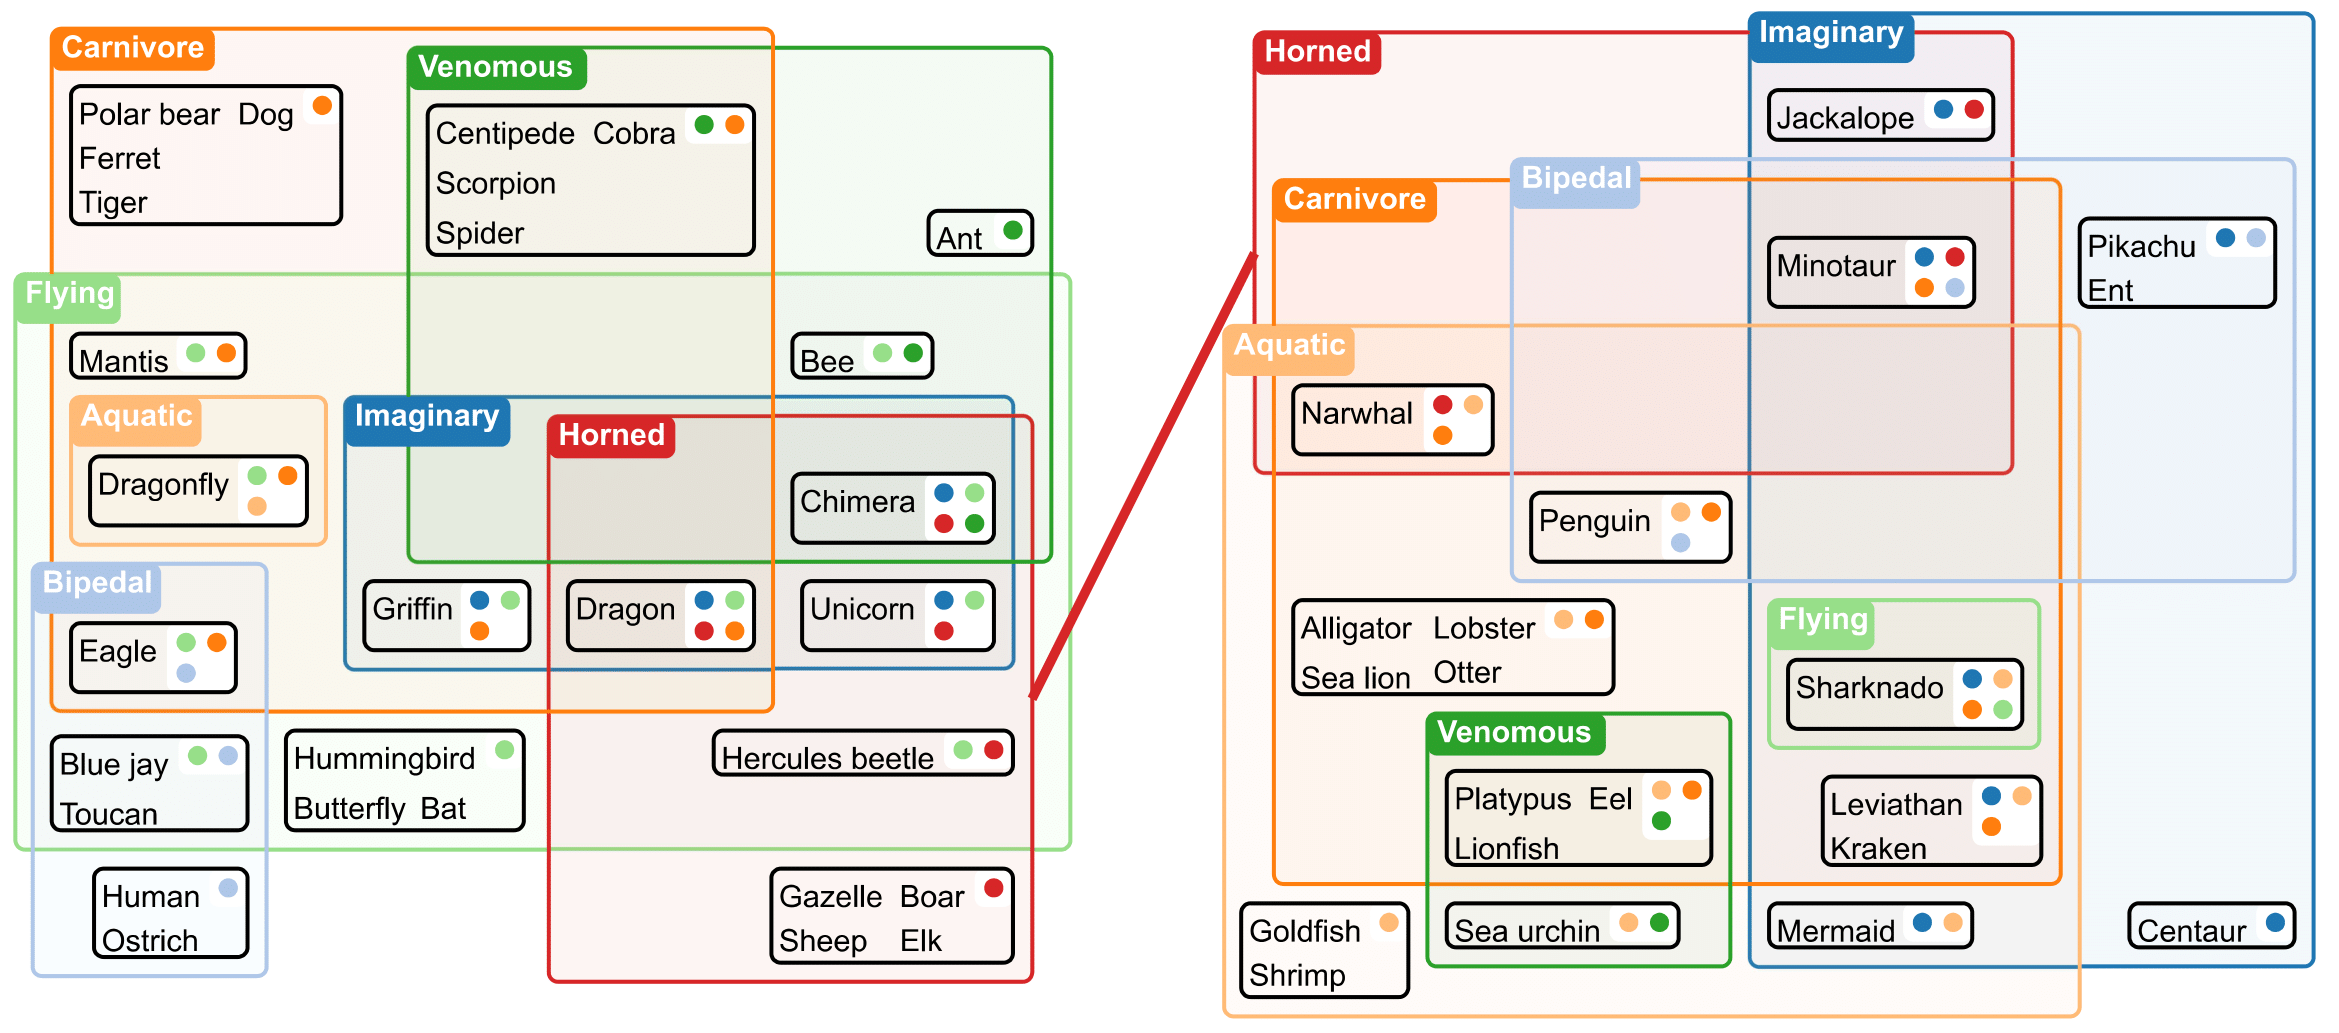
Animals and their attributes visualized by RectEuler: The optimization yields compact rectangles for each set. For complex datasets with many highly-overlapping regions it is not always possible to represent each set using a single rectangle. In these cases, the visualization splits into connected sub-layouts, which is the case for the ’Horned’ set. Our generation method is flexible and enables user customization of several properties, such as set colors, sizes, and contents.
Material
Abstract
Euler diagrams are a popular technique to visualize set-typed data. However, creating diagrams using simple shapes remains a challenging problem for many complex, real-life datasets. To solve this, we propose RectEuler: a flexible, fully-automatic method using rectangles to create Euler-like diagrams. We use an efficient mixed-integer optimization scheme to place set labels and element representatives (e.g., text or images) in conjunction with rectangles describing the sets. By defining appropriate constraints, we adhere to well-formedness properties and aesthetic considerations. If a dataset cannot be created within a reasonable time or at all, we iteratively split the diagram into multiple components until a drawable solution is found. Redundant encoding of the set membership using dots and set lines improves the readability of the diagram. Our web tool lets users see how the layout changes throughout the optimization process and provides interactive explanations. For evaluation, we perform quantitative and qualitative analysis across different datasets and compare our method to state-of-the-art Euler diagram generation methods.