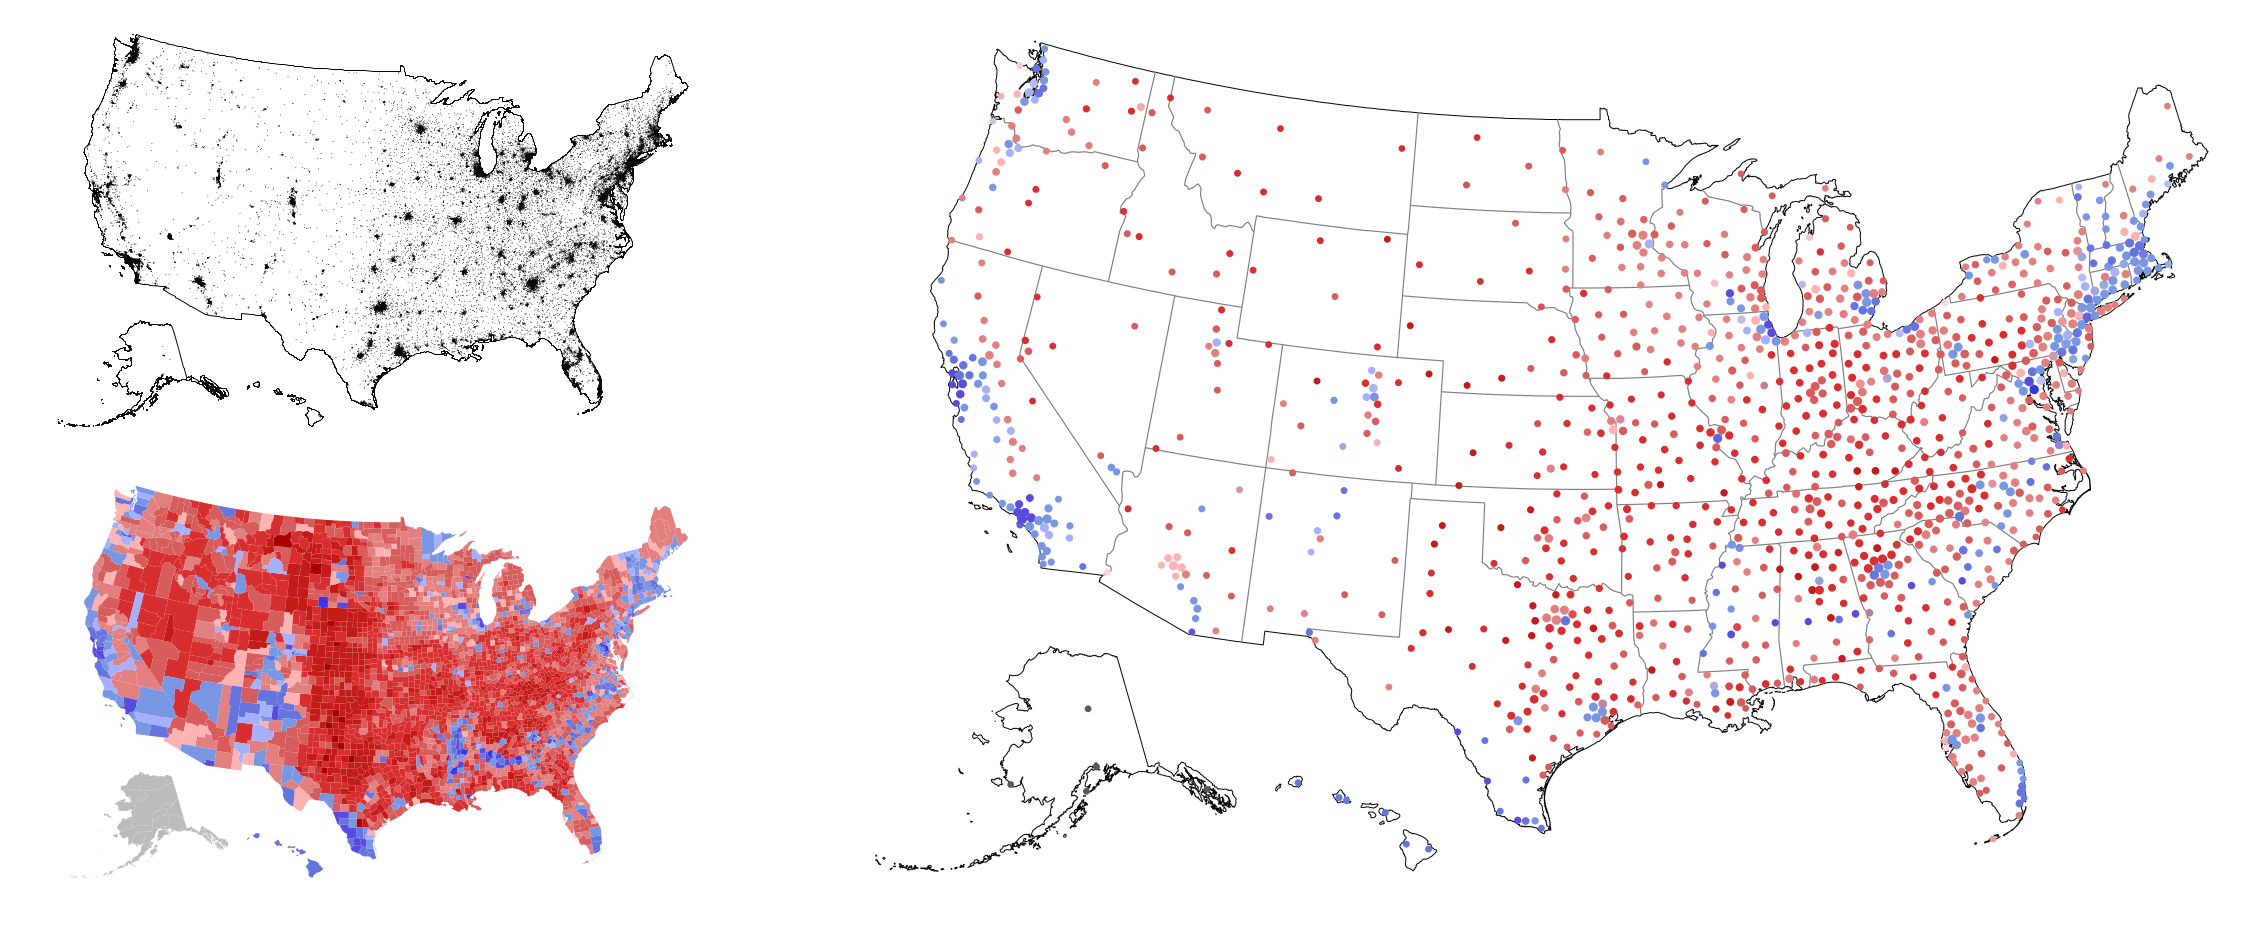
Stippled illustration of the 2016 election data from the United States (right) that combines the population density as the distribution of stipples (top-left, illustrated as dot map), and the vote difference for each administrative region (bottom-left, depicted using choropleth maps). Note how the stippled abstraction visualizes both aspects of the data simultaneously.
Material
Abstract
We propose a technique to represent two-dimensional data using stipples. While stippling is often regarded as an illustrative method, we argue that it is worth investigating its suitability for the visualization domain. For this purpose, we generalize the Linde--Buzo--Gray stippling algorithm for information visualization purposes to encode continuous and discrete 2D data. Our proposed modifications provide more control over the resulting distribution of stipples for encoding additional information into the representation, such as contours. We show different approaches to depict contours in stipple drawings based on locally adjusting the stipple distribution. Combining stipple-based gradients and contours allows for simultaneous assessment of the overall structure of the data while preserving important local details. We discuss the applicability of our technique using datasets from different domains and conduct observation-validating studies to assess the perception of stippled representations.